Get up close and personal with your materials...
Whether you require simple analysis for identification, contamination analysis of drug product or substance, more extensive interpretation of analytical data or development of analytical methods, we have the experience and techniques to meet your needs.Ask Our Scientists!
Request More Info
We have extensive expertise in
- Identification of unknown substances
-
Contaminant Identification
- Counterfeit Drug Identification and Patient Complaint Analysis
- Failure Analysis
- OOS Analysis
- Drug Product Uniformity and Distribution Analysis (Mapping and Imaging)
- Microscopic Analysis including Elemental Identification and Location
- Civil Forensics
- Method Development and Validation
- Release Testing
-
Patent Prosecution and Litigation Support (Infringement Analysis)

Chemical Imaging & Mapping
The nature of the solids in formulated drug products, both the API and excipients, affects product performance. The analysis of such complex mixtures can be challenging, often requiring specialized techniques like spectral mapping and imaging.Chemical imaging is a relatively new technique that requires sophisticated instrumentation. Triclinic offers Raman-based chemical imaging services. We also have experience utilizing image data obtained from near infrared devices and time of flight secondary ion mass spectrometric (TOF-SIMS) measurements.
Chemical imaging involves collection of an array of spectra covering a two-dimensional area. The data can be processed to give visual images showing the location of individual chemical species within the sampled area, or to measure physical features of mixture components such as particle size. Particularly useful has been the application of the techniques to solving problems associated with structured drug products like layered tablets or microspheres. Also, evaluation of mapping and imaging data can provide statistical measures of features like homogeneity or proximity of different chemical species. (See Figs 5,6.below).
New uses for chemical imaging are emerging with high frequency. Triclinic's scientists are experts in the area, are frequently used in legal matters as experts, and can bring the most up-to-date application theories to bear on a wide variety of problems.

Atomic Force Microscopy -
Imaging on the nanometer scale
| Application AND Technique Description | ||
|---|---|---|
|
High-resolution scanning probe microscopy with demonstrated resolution on the order of
fractions of a nanometer, more than 1000 times better than the optical diffraction limit.
One of the most important tools for imaging on the nanometer scale, Atomic Force
Microscopy uses a cantilever with a sharp probe that scans the surface of the specimen.
When the tip of the probe travels near to a surface, the forces between the tip and
sample deflect the cantilever according to Hooke's law.
The atomic force microscope is a powerful tool that is invaluable if you want to measure incredibly small samples with a great degree of accuracy. Unlike rival technologies (e.g. electron microscopy), it does not require either a vacuum or the sample to undergo treatment that might damage it. One of the major downsides is the single scan image size, which is of the order of 150x150 micrometers, compared with millimeters for a scanning electron microscope. Another disadvantage is the relatively slow scan time, which can lead to thermal drift on the sample. |
||
| Instrument Brand | Model | References |
| Hitatchi and Park | All Modes | Wiki Reference for Atomic Force Microscopy |
| Uses | ||
| Surface mapping and Topography | ||
FT-IR Infrared Spectroscopy -
Identify known and unknown organic and inorganic materials
| Application AND Technique Description | ||
|---|---|---|
|
An FTIR spectrometer simultaneously collects high-spectral-resolution data over a wide
spectral range. This confers a significant advantage over a dispersive spectrometer
(e.g. Raman), which measures intensity over a narrow range of wavelengths at a time.
FTIR spectrometers are mostly used for measurements in the mid and near IR regions.
The technique is used to obtain an infrared spectrum of absorption, emission,
photoconductivity or Raman scattering of a solid, liquid or gas for identification.
We spectrally match acquired spectra to our databases of over 1.5 million known compounds.
The term Fourier-transform infrared spectroscopy originates from the fact that a Fourier transform (a mathematical process) is required to convert the raw data into the actual spectrum. Since information from all wavelengths is collected simultaneously. It results in a higher signal-to-noise ratio for a given scan-time. Attenuated total reflectance (ATR) ATR is an accessory used to measure surface properties of solid or thin film samples rather than their bulk properties. Generally, ATR has a penetration depth of around 1 or 2 micrometers depending on your sample conditions. |
||
| Instrument Brand | Models and Software | References |
| Thermo | iS50, Model 60825
Nicolet 6700 ATR, diffuse reflectance, transmission, gas cell, spectral library matching. Omnic 9.7.46 Software |
Wiki Reference for FTIR |
| Uses | ||
| Unknown and known chemical identification | ||
Hot Stage Optical Microscopy -
Reveal Thermal Behavior
| Application AND Technique Description | ||
|---|---|---|
| A technique for studying the phases of solid drug substances and cocrystal development using a programmable melting apparatus. Also known as fusion methods; thermo-microscopy. Useful for identifying fusable solids. | ||
| Instrument Brand | Model | References |
| Linkam |
LTS420
Ambient - 600 °C |
Wiki Reference for Hot Stage Microscopy |
| Uses | ||
|
Studying the phases of solid drug substances, thermal behavior
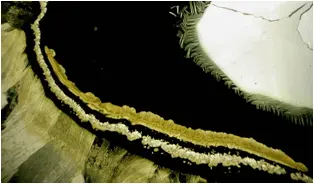
Figure 1. Hotstage Image showing the eutectic melt interface of two components where a new form is present (Yellow band in middle of image). |
||
Microtome preparation of samples -
Prepare flat or ultra thin materials
| Application AND Technique Description | ||
|---|---|---|
|
Used to cut extremely thin slices of material or to provide ultra flat surfaces - cut
thickness achievable on a rotary microtome is between 1 and 60 µm.
An ultramictrotome allows for the preparation of extremely thin sections, with the device functioning in the same manner as a rotational microtome, the linear thermal expansion of the mounting is used to provide very fine control of the thickness. These extremely thin cuts are important for use with transmission electron microscope (TEM) and serial block-face scanning electron microscopy (SBFSEM), and are sometimes also important for light-optical microscopy. The typical thickness of these cuts is between 40 and 100 nm for transmission electron microscopy and often between 30 and 50 nm for SEM. |
||
| Instrument Brand | Models | References |
| Leitz and MTX |
Rotary - Tungsten-Carbide, stainless steel, and Diamond Blades
Ultramicrotome - Tungsten-Carbide and Diamond Blades |
|
| Uses | ||
Preparing flat surfaces for imaging and analysis
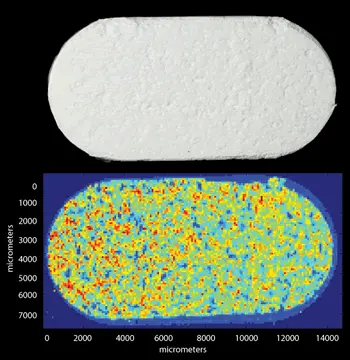
Figure 2. Images showing a tablet prepared by microtomy for surface analysis (top image). Dispersive Raman mapping of tablet showing three different chemical components (yellow, blue, red) and their distribution. |
||

See the mini case study below for additional examples of Raman Mapping
Optical Microscopy -
Magnify images of small objects
| Application AND Technique Description | ||
|---|---|---|
|
Microscopes are instruments designed to produce magnified visual or photographic images
of small objects. The microscope must accomplish three tasks: produce a magnified image
of the specimen, separate the details in the image (resolution), and render the details
visible to the human eye or camera.
Magnification is a function of the number of lenses. Resolution is a function of the ability of a lens to gather light. Apertures can be used to affect resolution and depth of field. Polarized light microscopy is capable of providing information on absorption color and optical path boundaries between materials of differing refractive indices, in a manner similar to bright-field illumination, but the technique can also distinguish between isotropic and anisotropic substances. Crystals with non-cubic crystal structures are often birefringent, as are plastics under mechanical stress. A partial list of the properties that can be determined with polarized light microscopy would include size, shape, color, density, surface texture, refractive indices, transparency/opacity, crystal habit, crystal system and interfacial angles. |
||
| Instrument Brand | Models and Software | References |
| Leica and Keyence Digital | M80 - Stereo Still and dynamic image capturing
DM2500P - Compound Still and dynamic image capturing Keyence VHX-2000E Digital - Still and topography image capturing Polarizing Light Microscope Pax-it2! V.1.4.3 Software |
Wiki Reference for Microscopy |
| Uses | ||
| Still and dynamic image capturing, topography analysis | ||
Infrared Imaging -
Chemical, physical, and distribution information of a sample
| Application AND Technique Description | ||
|---|---|---|
|
Provides chemical, physical and distribution information. Analyze samples as small as
50 microns with no need for liquid nitrogen. Allows the analysis in reflection and ATR
of samples as thick as 20 mm with no need to remove condenser. Over 20 mm samples can
be measured, depending on the overall size.
Chemical imaging, microsampling, 1um resolution, Spectral range 7600-375 cm-1 Collection of data in any sampling mode (transmission, reflection and ATR). Extended range allows inorganics and fillers analysis. Ultra fast imaging speed allows the collection of 1.2 x 1.2 mm image in as low as 20 seconds instead of 4.5 minutes of ultra-fast mapping. Real-time identification of samples with material identification, size, percentage of distribution, and chemical image of particles within an area. |
||
| Instrument Brand | Model and Software | References |
| Thermo | iN10 MX, Model with Picta 1.5.141 software | Reference for IR Imaging |
| Uses | ||
|
Chemical, physical, and distribution information of a sample
Contaminant identification, materials analysis and counterfeit analysis. The techniques are also useful for intellectual property support (patent prosecution and litigation). |
||
RAMAN Spectroscopy -
Identify molecules, study chemical bonding, spatially locate chemicals
| Application AND Technique Description | ||
|---|---|---|
|
Raman is a spectroscopic technique used to observe vibrational, rotational,
and other low-frequency modes in a system. Raman spectroscopy is commonly used in chemistry
to provide a structural fingerprint by which molecules can be identified. A sample is
illuminated with a laser beam. Electromagnetic radiation from the illuminated spot is
collected with a lens and sent through a monochromator. Elastic scattered radiation at
the wavelength corresponding to the laser line (Rayleigh scattering) is filtered out by
either a notch filter, edge pass filter, or a band pass filter, while the rest of the
collected light is dispersed onto a detector.
We specialize in hyper-spectral imaging or chemical imaging, in which thousands of Raman spectra are acquired from all over the field of view. The data can then be used to generate images showing the location and amount of different components. Raman spectroscopy is suitable for the microscopic examination of minerals, polymers and ceramics, forensic trace evidence, organic and inorganic materials, and to differentiate polymorphic forms of active pharmaceuticals. |
||
| Instrument Brand | Models and Software | References |
| Renishaw
Thermo Ondax |
Dispersive Raman: inVia Chemical imaging, microsampling, Confocal, 785 nm laser
FT Raman: Thermo FT Micro and macro sampling, 1064 nm laser, Omnic v.9.7.46 software with spectral libraries. Low frequency: Ondax THz-Raman® With Probe Stokes and anti-Stokes signals from ±5 cm-1 to 200 cm-1, (or 150 GHz to 6 THz) |
Wiki Reference for Raman spectroscopy |
| Uses | ||
|
Chemical imaging, microsampling, distribution, location, and failure analysis
Identify molecules, study chemical bonding, spatially locate chemicals |
||
See the mini case study below for examples of Raman Mapping
Scanning Electron Microscopy Imaging and Analysis -
Image ultrastructure and determine elemental composition
| Application AND Technique Description | ||
|---|---|---|
|
Scanning Electron Microscopy (SEM) presents the opportunity to analyze samples for
both morphological characterization and composition. Use of high-resolution field
emission SEM can give detailed information on particle size, crystal shape and packing
and overall structural characterization. SEM data is extremely helpful in identifying
causes for manufacturing inconsistencies or in solving quality control issues.
CryoSEM involves freezing hydrated samples at temperatures as low as -130oC. and then examining their structure using SEM while they are frozen. This is the only way to fully evaluate a bulk, hydrated system without withdrawing any of the bound water. This powerful imaging technique allows sublimation of unbound water from the freshly fractured face of the frozen sample, revealing the basic underlying structure. Ideal samples are hydrogels, hydrated coatings and microbeads, tissue replacement products, and polymers that would normally deform under the electron beam. When performing SEM, primary beam electrons interact with sample atoms to produce X-rays that carry information as to the type of atoms, and thus elements, in the sample. Electron dispersive x-ray analysis (EDX) utilizes this production of X-rays to identify types and locations of elements within the sample area. Such information can be displayed as a simple spectrum identifying the elements present, as elemental maps or line scans across the sample surface, or as a compositional determination of weight percentage or atomic percentage of the elements present based on their mass. We utilize a field emission SEM and associated EDX system, with a highly sensitive silicon drift detector (SDD), to identify impurities and unknown contaminants within samples and verify sample composition (Fig 3). 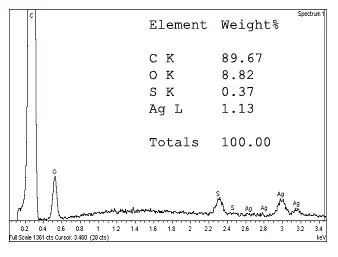
Figure 3. EDX analysis of Silvadene Cream (Silver Sulfadiazine) confirms the manufacture’s claim of 1% silver. Sulfur (S) has an atomic mass of 32.065 compared to that of a silver (Ag) atom at 107.86. With only one atom of each in the molecular formula for this compound, the ratios, based on weight% determined by EDX analysis, is correct within a reasonable margin of error. |
||
| Instrument Brand | Models and Software | References |
| FEI
Oxford |
Quanta 3D FEG High and low vacuum, cryo capability
INCA PentFEXx3 Energy dispersive x-ray spectroscopy (EDX) |
Wiki Reference for SEM
Our Capabilities: Scanning Electron Microscopy (SEM) o High Vacuum o Low Vacuum o Cryo o Energy Dispersive X-ray Analysis (EDX) |
| Uses | ||
| Investigate ultrastructure | ||
Mini Case Study:
Drug Product Content Identification and Component Distribution Using Imaging
A multi component drug product was prepared for analysis by Raman Chemical Mapping using embedding and microtoming procedures developed at Triclinic Labs (Fig. 2). Raman Chemical Images for four identically prepared tablets were analyzed and each major chemical component was assigned a color (Fig. 3). Comparisons were then performed for generic and innovator tablets (Fig. 4). Similar analysis can be performed to demonstrate infringement or content uniformity.
Figure 4. Multi component drug product embedded and microtomed to produce a flat surface for subsequent Raman Mapping.
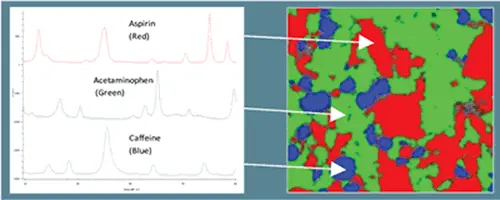
Figure 5. Raman Chemical Image of prepared multi component drug product. By assigning a different color to the spectrum of each component the spacial distribution of all three components can be viewed in a single image
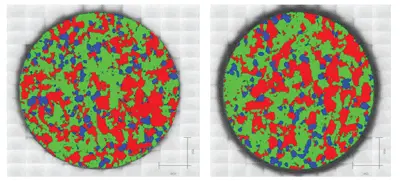
Figure 6. Raman Chemical Image of four different analgesic tablets. Can you find the innovator’s tablet? Far Left: CVS Brand Extra Strength Medication, Left: Walgreens Brand, Right: Equate (Walmart) Brand, Far Right: Excedrin Extra Strength Medication. Notice content uniformity, domain size, and relative component abundance in each.
Service Levels Available: